
My market reviews are broad and high-level. Drop me a line if you’d like to have me take a closer look at your micro-market segment, or to receive these market updates delivered to your inbox.
I’m very cautious to avoid over-emailing, and only send out communications quarterly, at most. That’s a promise.
Seattle + Eastside Market Recap
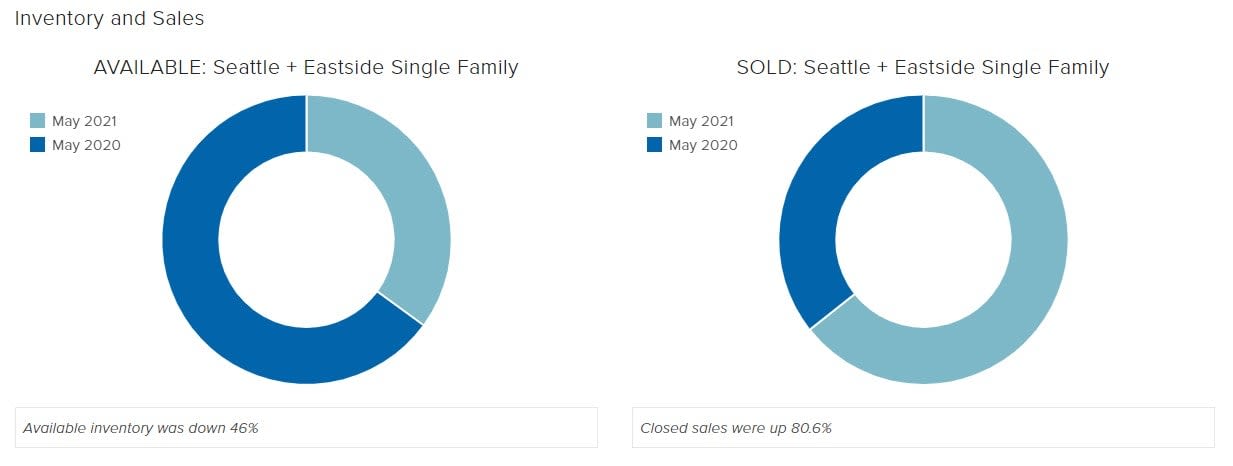
In the first half of 2021, we continued to see record-low inventory and higher-than-normal numbers of sales, as well as ongoing hyper-low interest rates, local tech company hiring, and wealth growth from a rising stock market. As the vaccine rolled out, several major employers announced the likelihood they will continue to allow employees to work from home a few days per week, even after they have fully re-opened their offices. This means the trend of workers moving further out or simply to new digs with better home offices is likely to continue.
Since the first of the year, these factors poured accelerant on the already-flaming-hot real estate market. Single-family home sellers are highly favored, buyers compete vigorously for what little inventory there is, and prices keep climbing.
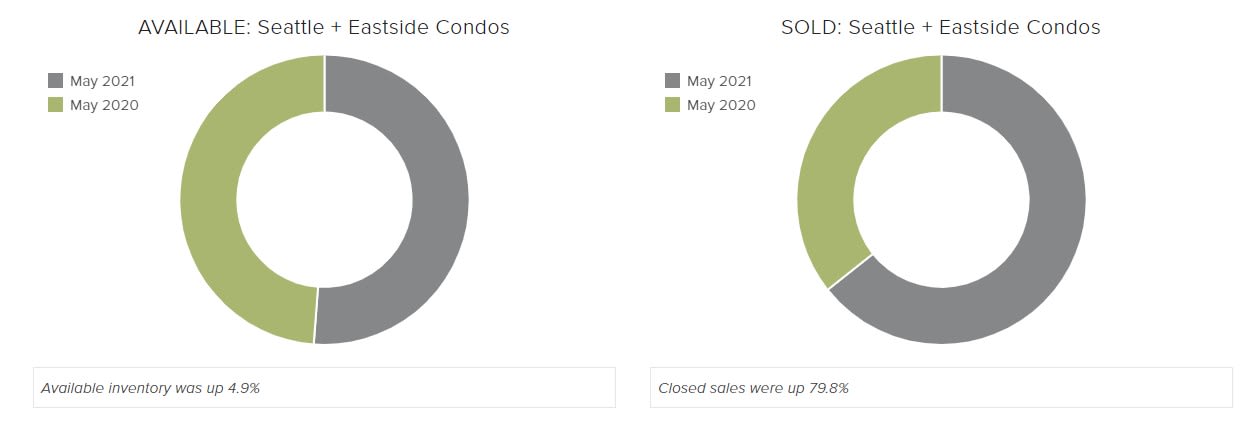
Central Seattle condos, especially downtown, continue to lag, following the trend of the past year that saw many homeowners turning away from apartment-style living due to the restrictions of COVID lockdowns and the shuttering of so many of the urban restaurants and amenities that make condo living fun. However, there are signs the condo market is recovering, as vaccine rates continue climbing in King County, businesses re-open, and life returns to the streets.
The following data is for properties under $5 million. For information on how the $5 million-plus market is performing, please contact me.
Price Trends (May 2020 vs. May 2021)
Single-family Homes: Average Price per Square foot up 26.4%. Median Sale Price up 27.3%
Seattle Condos: Average Price per Square foot down 13.3%
Eastside Condos: Average Price per Square foot up 11.3%
Market Times
Zooming back out to all King County properties, May’s market times (how long it takes a listing to sell, on average) were at 14 days. This is compared to 19 days for the same period in 2020.
List to Sale Price Ratios
On average in May of 2021, sellers got 107% of their list price. Last year in May that number was 99%.
Looking Ahead
As of this writing, Seattle was just reported to be the fastest-growing big city in America for July 2020 – July 2021, adding 16,400 new residents, or 2.2%, despite a global pandemic and civil unrest. This while San Francisco, San Jose, and New York City actually shrunk by over 1%. Meanwhile Kirkland, in the smaller city category, grew by 2.6%.
So we have local population growth, plus all the factors listed in the Market Recap above, plus the fact that we already had a historic inventory shortage prior to the pandemic. You can see why I don’t see our supply catching up to our demand any time soon, even as sellers who were waiting for a vaccine and schools to re-open finally do begin listing their homes.
Micro Markets Matter
As always, different neighborhoods, prices, and property categories usually perform differently. Whenever you have a question, need or curiosity about your own situation, please don’t hesitate to reach out.
However the future unfolds, you can be assured I stand ready to help you explore, clarify and achieve your own particular real estate goals with customized strategies that consider market conditions through the lens of your unique needs and situation.
Share:
